
Lunar Missions Video Blog
Mike Loucks and I were at agi.com last week in their new studio and we recorded this video blog on YouTube with Josh Poley. We’re talking about some Lunar missions we worked on:
Great Article about LADEE that somehow didn’t get posted here 3 years ago
Not sure why this never got posted, but I meant to put this link up 3 years ago during the middle of LADEE OPS. I created a draft version of the post, and then lost track of it.
Anyway, here’s a great article written by Liz Fuller-Wright, an excellent writer from the CSM who interviewed John and me about LADEE during the midst of the phasing loops.
Moon mission LADEE arrives after an ‘amazingly precise’ looping flight
“Back of the Envelope” Astrogation: Re-creating the New Horizons Trajectory

A “Star Wars” Rebel astrogation Officer does some “back of the envelope” work
As I was watching the great success of the New Horizons team, I became motivated to do a bit of quick “back of the envelope” calculations to re-create the trajectory. I don’t have to start completely from scratch, because in 2004 I created an STK/Astrogator tutorial giving the basic ideas of how to set up the New Horizons trajectory:
Astrogator New Horizons Tutorial
I thought it would be fun to update things and make them closer to what was actually flown. I can easily do so because the New Horizons Astrogator Yanping Guo (along with legendary Astrogator Bob Farquhar) gave me what I need in this paper:
Yanping Guo and Bob Farquhar: New Horizons Mission Design
I will refer to this from now on as “Yanping’s paper” just for simplicity, but Farquhar helped write it as well.
I’m going to do this in STK/Astrogator, but the basic idea would be similar in other software. I’ll update my scenario a bit to include the launch portion along with the published B-plane parameters at from Yanping and see if our geometry lines up with hers. (STK/Astrogator was actually used for the New Horizons mission, which makes this even more relevant. It was also used on Messenger, LRO, LCROSS, LADEE, etc… but I digress.)
Launch Targeting
Firstly, let’s get the launch set up, so that I can hit the right time of the launch coming out of KSC. The Launch vehicle used was an Atlas 551, a beast of an Atlas with 5 solid boosters, a Centaur upper stage, a Star 48B on top and the 5 meter fairing. That’s actually one heck of a stack of stages. Here’s a really cool report of the launch events, according to Jonathan McDowell:
Jonathan’s Space Report No. 560
“The powerful Atlas 551 rocket, with five solid boosters, roared off the Florida pad after two days of delays. The solids separated at 1 min 45s into launch, arcing into the mesosphere before falling to Earth. The 5-meter-diameter fairing separated at 3min 23s, followed seconds afterwards by the two pieces of the CFLR (Centaur Forward Load Reactor), a contraption that connects the smaller 3.1m-diameter Centaur to the fairing for structural stiffness. By this time Atlas was in space, with the fairing probably reaching an apogee of 150 km or so. Atlas shut down at 4min 27s, falling away 6s later, and the Centaur second stage ignited at 4min 33s as the trajectory flattened out, reaching orbit insertion at 1910:08 UTC with a 167 x 213 km parking orbit. The vehicle coasted for 20 minutes and restarted over South Africa, with a 9-min burn taking the Centaur to 800 km altitude at a velocity of 12.4 km/s, a hyperbolic Earth orbit which will take the Centaur out to the asteroid belt. At 1939 UTC the spin-table on the forward end of the Centaur began to rotate, and the injection stage with the payload separated. The injection stage is an Alliant (Thiokol) Star 48B solid motor, the same motor used on Delta 2 third stages and on the old Shuttle PAM-D flights. Solid kick motors like to be spinning when they fire to even out any misalignment of the thrust direction, hence the spin table – although the Star 48B also has a set of small hydrazine rockets to correct any unwanted nutation. After the Star 48B burn, the payload had reached escape velocity not only with respect to the Earth but also relative to the Sun (The velocity was 16.2 km/s relative to the Earth and I estimate an asymptotic velocity of 12.3 km/s, corresponding to 42.6 km/s relative to the Sun and leading to a heliocentric eccentricity of around 1.05)”
(You should follow Jonathan on twitter: @planet4589 and you can find the latest version of his “Jonathan’s Space Report” here: Jonathan’s Space Report)
I have to divert a bit from my deep space trajectory because I’m geeking out about the Atlas 551. That’s a sweet rocket. Let’s see a picture of the stack from the launch press kit:
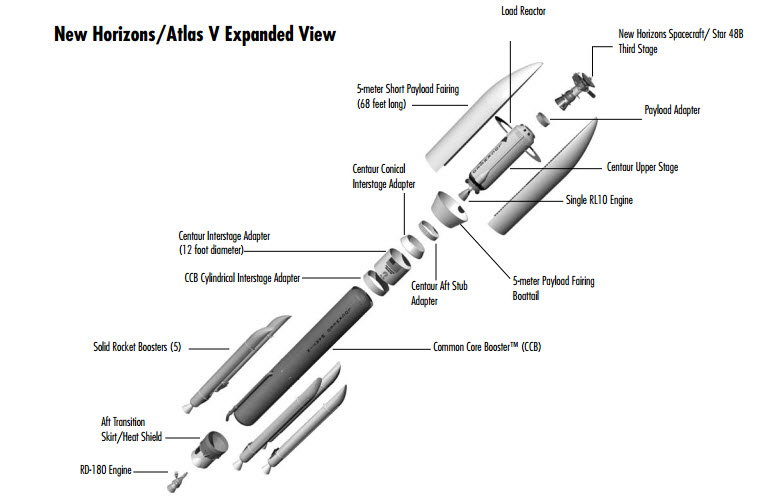
New Horizons Atlas 551 Launch Stack (From NH Launch Press Kit) Click to Enlarge
Ok, let’s just look at rocket itself. (You really want to click on this one, it’s a cool rocket!)
![New Horizons Atlas 551 (5 meter fairing, 5 solids, 1 RL10 on the Centaur) [Click to enlarge]](https://astrogatorsguild.com/wp-content/uploads/2015/07/NewHorizons_Rocket_Bly.jpg)
New Horizons Atlas 551 (5 meter fairing, 5 solids, 1 RL10 on the Centaur) [Click to enlarge]
The Star 48B is a very reliable (and available) upper stage, and stacking it on top of a Centaur is pretty unusual, but necessary for the high C3 (157.64 km^2/sec^2). That C3 is (as noted by Jonathan) hyperbolic with respect to the Sun!
Let’s take a quick look at the staging profile (also from the press kit):
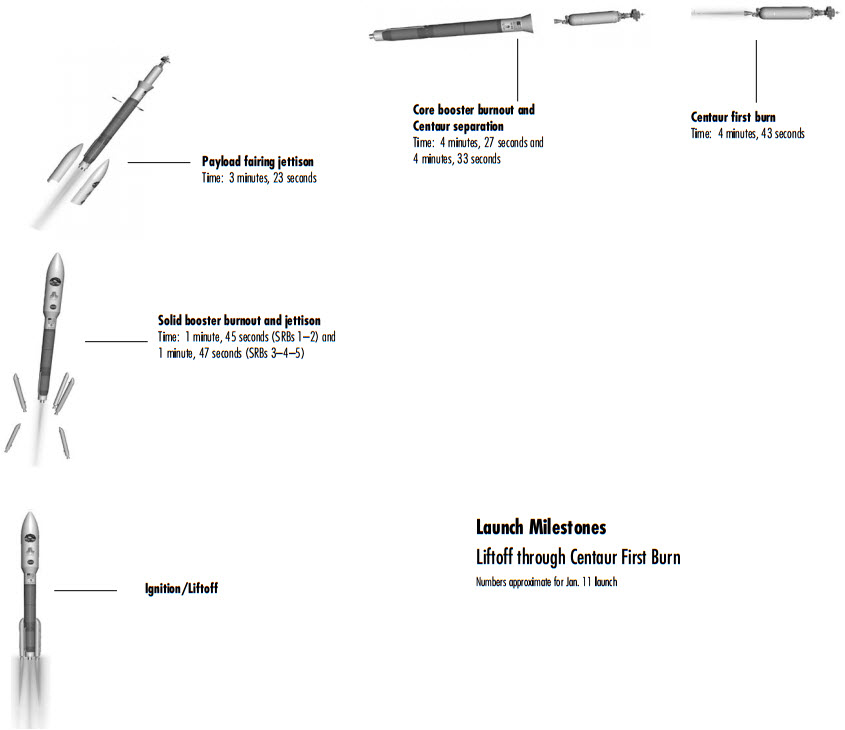
Launch Events (1 of 2)
[Click to Enlarge)

Launch Events (2 of 2)
[Click to Enlarge)
Our purpose here is to duplicate the interplanetary trajectory, so I’m not compelled to completely duplicate the launch segment. I’m going to model all burns as impulsive burns (I don’t have their engine models anyway) and I’m going to combine the Centaur and Star 48B into one insertion burn. It’s fine to do this, since ultimately the multiple insertion burns are just targeting a single trajectory after launch, with a single defined asymptote. The Centaur and Star48 burns were optimized to hit a single asymptote, so I’ll just model that part.
From my NH tutorial mentioned earlier, I will re-use these asymptote conditions:
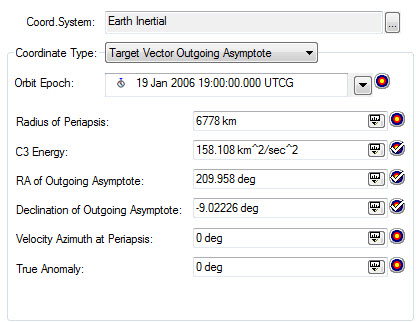
2006 New Horizons Asymptote (from Trajopt)
These conditions came originally from Trajopt (an old DOS program written at SAIC) and they’ll be good enough. I could have gotten them from a variety of other sources that help you search for planetary swingby opportunities. I’ve used MAnE, Trajopt and “Swingby Calculator”, and there are many others. Regardless, these conditions are plenty good and they ought to get me to the Jupiter swingby, and then I’ll work from there.
So I will launch out of KSC with these conditions:
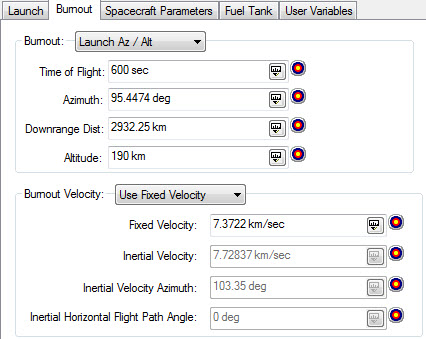
Astrogator Launch Burnout Conditions
In STK/Astrogator, we model the launch as a portion of an ellipse that starts at the ground and then meets the launch insertion state. This is a decent estimate of the burnout state. After the launch, we’ll coast in orbit for a bit, and then execute an escape maneuver. The mission control sequence for that looks like this:
STK/Astrogator Single Targeter to hit outgoing Asymptote
So I’ll vary my launch time (to get the orbital plane, or the Right Ascension of the asymptote) , my coast duration before the impulsive escape delta-v (to get the Declination of the asymptote) and the delta-v itself (to get the C3, or energy) to hit the asymptote conditions. When I do that, I get this type of a flyby at Jupiter:
New Horizons Trajectory with Asymptote only.
So using the Trajopt asymptote does actually create an encounter with Jupiter, but I don’t get anywhere near Pluto. According to Yanping’s paper, my flyby should look like this:
![New Horizons Jupiter Flyby (from Yanping's paper sited earlier) [Click to Enlarge]](https://astrogatorsguild.com/wp-content/uploads/2015/07/yanping-flyby-geometry.jpg)
New Horizons Jupiter Flyby (from Yanping’s paper sited earlier) [Click to Enlarge]
But if you go into the Jovian system for my flyby, you’ll see this:
Asymptote only targeting, Jupiter flyby side view

Asymptote only targeting, Jupiter flyby side view
So that tells me that the asymptote isn’t going where I want. I can fix that pretty easily. Yanping gives me the B-plane parameters I need at Jupiter to continue on the Pluto. If I match these parameters, I should then be close enough to an encounter with Pluto that Astrogator can target me the rest of the way in. I’ll match them by slightly varying my departure asymptote parameters.
The B-plane is a fictional plane that is used for precise targeting during a gravity assist or for planetary orbit insertion. It can be best thought of as a bulls-eye or target plane attached to the assisting body. The trajectory’s intersection point on the B-plane is where the spacecraft would go if the swingby planet had no gravity. This turns out to be useful because B-plane targets behave very linearly as you move the trajectory around (while targeting) while the actual periapsis point (or closest approach point) doesn’t move very linearly near the planet due to the non-linear force of gravity.
The B-plane is defined to be the plane that contains the focus (usually the center of mass of the body) of an idealized two-body trajectory (assumed to be a hyperbola) that is perpendicular to the incoming asymptote of that hyperbola. The incoming and outgoing asymptotes, S and O, and the focus of the hyperbola are contained in the trajectory plane, which is perpendicular to the B-plane. The intersection of the B-plane and the trajectory plane defines a line in space. The B-vector is defined to lie along this line, starting on the focus and ending at the spot where the incoming asymptote pierces the B-plane. A reference vector (R) is used to externally define the other planar axis. There are different choices to use for R. Typical examples are the planet’s orbit normal, or the planetary pole vector. You can use whatever you want, as long as you specify what it is (so others can duplicate what you’re doing, like I’m about to do)
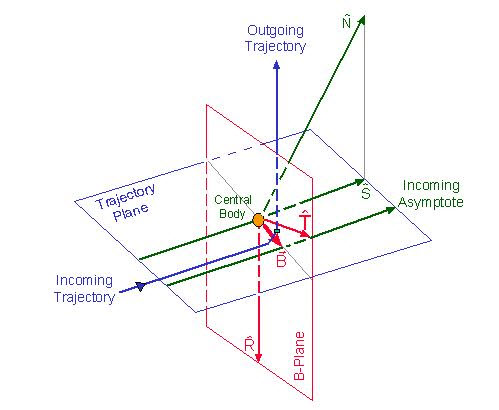
Bplane Definition
The vectors T and R lie in the B-Plane and are used as axes. The coordinates of our point in the coordinate system defined by those axes are called BdotT and BdotR, and they are the standard parameters given that allow you to target a swingby.
My initial state from Trajopt gives me the right direction for my transfer trajectory to get close to our B-plane targets (i.e. somewhere in the Jovian system), but I’m going to substitute in the B-plane parameters from Yanping’s paper instead of those that Trajopt originally generated. This should get me close enough to Pluto to hit our B-plane targets later.
I will target the following at Jupiter (From Yanping):
B-Plane Target:
B dot T = 342421 km
B dot R = 2629560 km
Jupiter Periapsis (closest approach) time = 28 Feb 2007 12:00:00.000 UTC
(Jupiter’s North Pole Reference frame)
I’ll use these parameters for now, and then let them be varied later. On the real mission, Yanping used trajectory correction maneuvers (planned for up to 25!), and didn’t try to accurately hit the Pluto B-plane precisely all the way back from launch. I can get away with that here, so I will. If I wanted to simulate how a real mission would do it, I’d truncate off my asymptote solution back at Earth, and our B-plane targets at Jupiter and recover from those errors with TCMs. In a numerical simulation, I can pretend that I can hit targets much more precisely than I can in real life, so I’m going to cheat here and do that.
I will use a double-nested targeter to achieve our goals. The inner targeter varies the Launch Time, the Coast duration, and the Injection delta-v to achieve the asymptote conditions. The outer targeter will vary the asymptote conditions of the inner targeter (RA, Dec and C3 of outgoing asymptote), in order to achieve the desired B-plane parameters and arrival epoch at Jupiter. So I’m going to let the targeter vary my first guess at the outgoing asymptote from Earth (the guess that came from Trajopt) in order to hit the B-plane parameters that Yanping says I need. The Astrogator MCS for this is below:
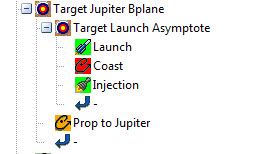
STK/Astrogator Mission Control Sequence with Double Nested Targeters
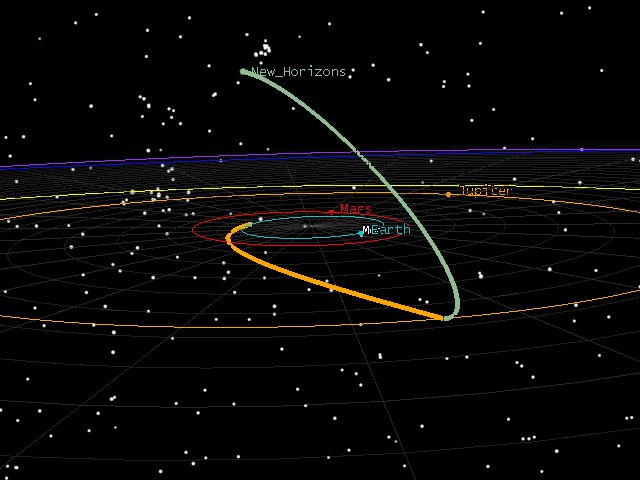
After this converges, my trajectory looks like this (view at Pluto closest approach):
![New Horizons Trajectory with Jupiter Bplane Targeting [Click to Enlarge]](https://astrogatorsguild.com/wp-content/uploads/2015/07/bplane_target2.jpg)
New Horizons Trajectory with Jupiter Bplane Targeting
[Click to Enlarge]
Which is a lot closer. The Pluto arrival date isn’t exactly right and while it looks close on the solar system scale, I am actually 5.9 million km from Pluto at periapsis. This shouldn’t surprise me though, because I haven’t really targeted anything at Pluto yet. I am relying solely on the Jupiter B-plane parameters to get us there. At the Jupiter flyby, my geometry looks like this:
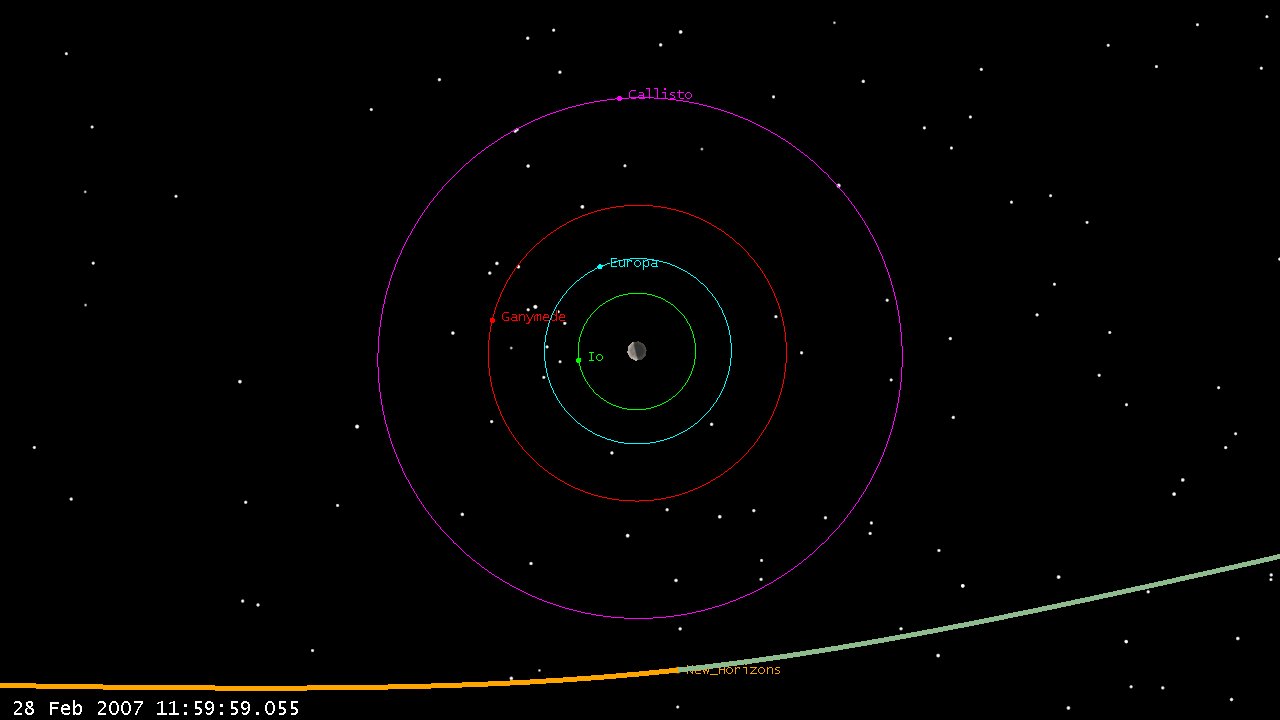
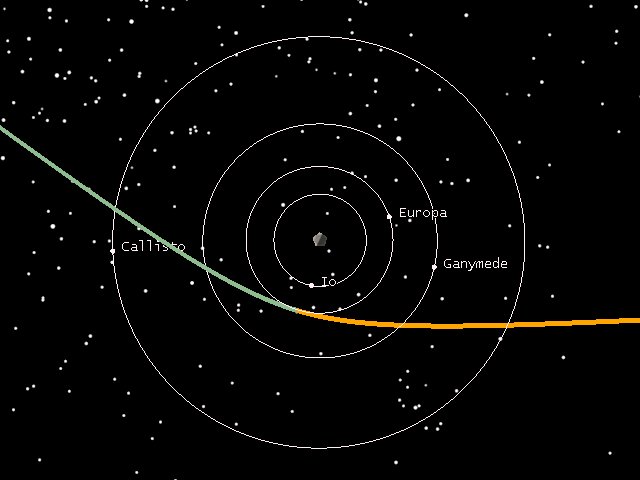
Bplane Targeting (double nested), Jupiter flyby top view [Click to Enlarge)
Which looks a lot more like the encounter geometry that Yanping showed in her paper. So now, I’d like to actually target my Pluto periapsis to the right spot and at the right time to match the encounter.
Again, I’ll rely on Yanping’s paper to tell me what I want to hit:
B-Plane Targets:
B dot T = -10910.6 km
B dot R = 2041.9 km
Pluto Periapsis (closest approach) time = 14 Jul 2015 11:58:59 UTC
(Pluto orbit normal frame)
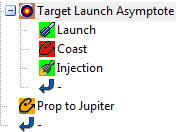
I will target this with a triple nested targeter (highly bogus in terms of trajectory realness in this case, but cool anyway). It looks like this:
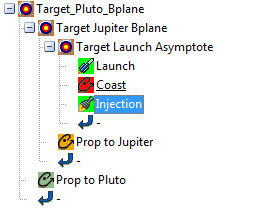
Triple Nested Targeter: Hitting the Pluto B-plane all the way from Insertion
1. The deepest internal targeter (Target Launch Asymptote) varies the launch time, coast duration, and burn delta-v to hit the outgoing asymptote (RA, Dec and C3 of asymptote)
2. The second targeter (Target Jupiter Bplane) varies the outgoing asymptote conditions of the deepest targeter in order to hit B-plane parameters at the Jupiter swingby.
3. The outermost targeter (Target Pluto Bplane) varies the B-plane parameters at the Jupiter Swingby in order to hit the desired B-plane parameters at Pluto.
This setup is simple but powerful and gets an answer, but I couldn’t really do this when flying a mission. It essentially has me targeting the Pluto B-plane accurately from conditions all the way back at insertion in Earth orbit! Launch vehicles can’t hit the asymptote RA and Dec within 0.000001 degrees, nor can injection maneuvers be executed with precision of 10e-6 meters. I’m going to ignore that though, since I know I’d have to do midcourses, and just enjoy the coolness of the trajectory.
So in my uber-precise mathematical universe we get this at arrival:
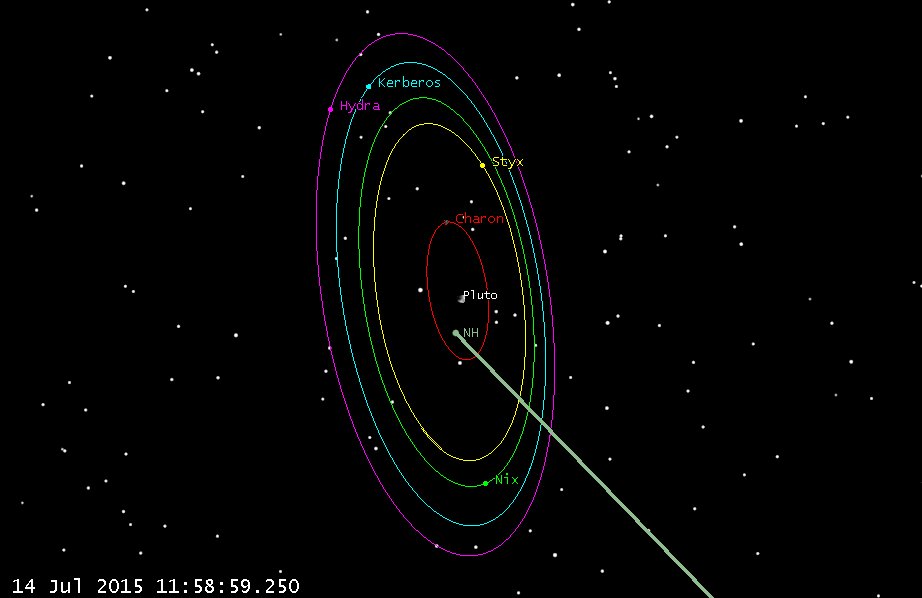
Pluto Periapsis Geometry
From Yanping’s paper she has the geometry looking like this:
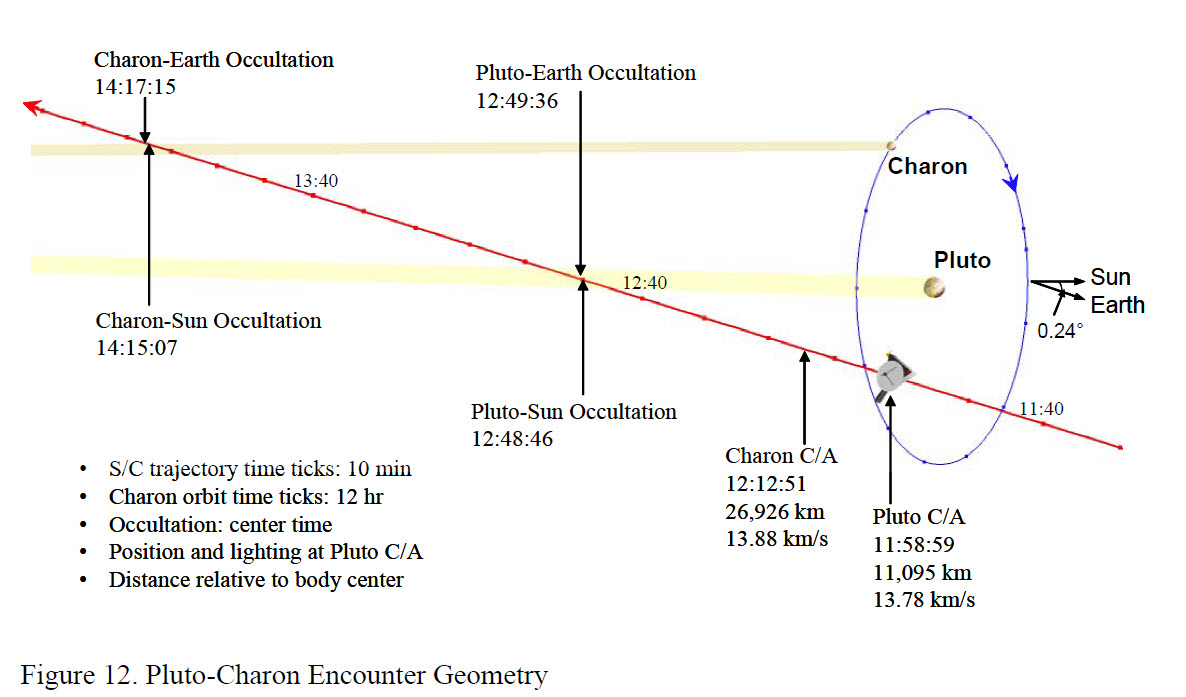
Pluto Approach Geometry (Gua and Farquhar)
We can also look at both sun occultations to see if they match up:
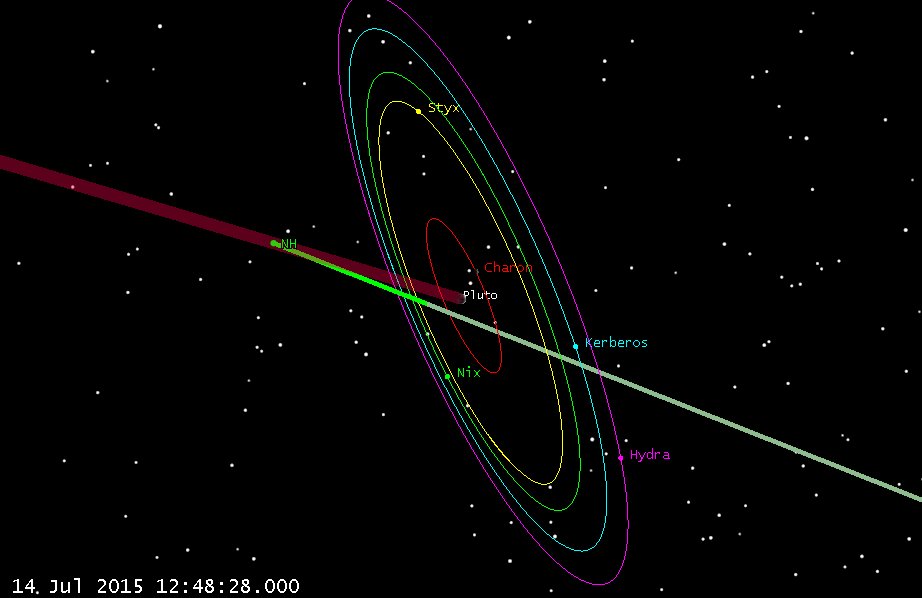
Pluto Occultation of Sun
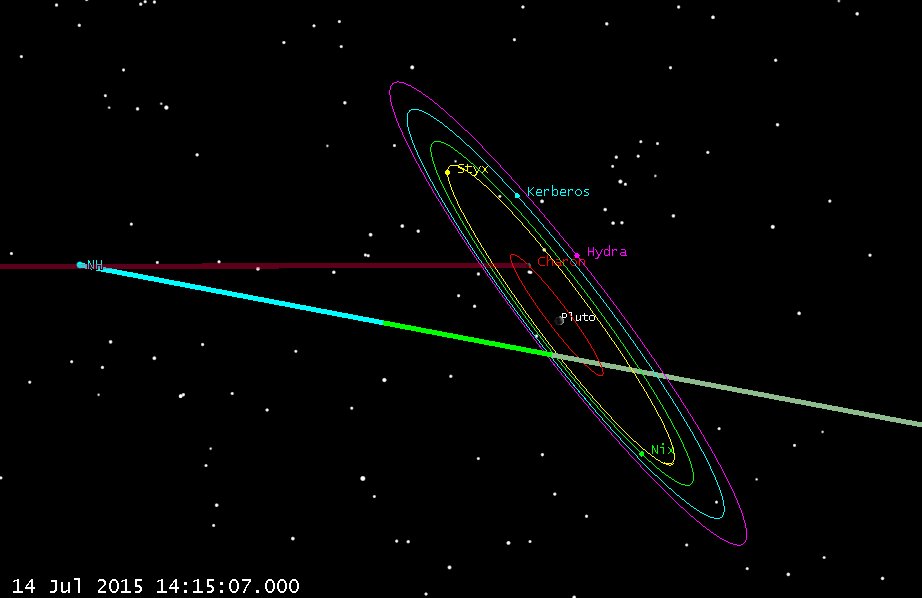
Charon Occultation of Sun
And they do (which is pretty satisfying!) Of course our fellow Astrogator Yanping Guo had to do things much differently than this, since she had to correct out insertion errors, attitude dumps, and Orbit Determination (OD) errors, etc. all along the trajectory for 9.5 years! In fact while they had planned 25 Trajectory Correction Maneuvers (TCMs), they only had to perform 9, which saved them 2/3 of the planned delta-v. This gives them plenty of delta-v to use to retarget to a Kuiper belt object later this year (pending additional NASA funding). Once they announce the target KBO object, I’ll update and extend my trajectory to match.
Also, I think the final conditions at the encounter may have been slightly off from what I have here (due to TCMs, adjustments, etc. that occurred after the paper was written). Once I get my hands on those conditions, I can trivially re-target things to achieve those states instead of what I hit above. (and I will, and will update here). What I’ve found so far has been conflicting, so I’ll stick with the paper. If someone has better data, pass it on. It’s easy to re-do.
I end this fun with a bit of animation showing the Plutonian system in action. I’d been wanting to see an animation of the system with the dual-planets co-orbiting, so I just made one myself. I love seeing Pluto dancing around the system barycenter. Planet and moon positions come from JPL SPICE files.
Here’s a link to the STK scenario.
If you’d like an ephemeris in a non-STK format, email me and I’ll create one for you.
Candidate Object on Asteroid Zoo could be “Snoopy” from Apollo 10
Interesting stuff, check it out:
http://talk.asteroidzoo.org/#/boards/BAZ0000002/discussions/DAZ0000889
The post mentions a previous Astrogator’s Guild posting:
Could the Meteorite crater in Nicaragua be related to Asteroid 2014 RC?
On CNN.com there was a story “Meteorite makes big crater in Nicaragua” by Amanda Barnett. In the article, Amanda wrote: ‘AP quoted government spokeswoman Rosario Murillo as saying they’ve determined it was a “relatively small” meteorite that “appears to have come off an asteroid that was passing close to Earth.”‘ Well, that’s enough to get someone wondering if indeed it could have come off 2014 RC, which just did the flyby this past Sunday, 7 Sep 2014 at 18:15 UTC.
Well, Adam Gorski at Analytical Graphics made this easy by posting an STK scenario on AGI’s website blog: Asteroid 2014 RC flyby on Sunday. Adam got 2014 RC’s ephemeris from the JPL Horizons website, and set everything up. THANK YOU ADAM!
In Amanda’s article, she says “The Nicaragua Dispatch said the hole is in the woods near Managua’s Sandino International Airport and about 1,000 feet (300 meters) from the Camino Real Hotel” which, according to Google Maps is at Latitude 12.148060, Longitude -86.184949. So, I put this into STK as a place object.
Amanda also mentions the time of impact, which is critical to this: “The Today Nicaragua site reported the crater was found after a loud blast about 11:05 p.m. on Saturday. ” Nicaragua is in the Central Time Zone, and from a few web searches seems that they do not use daylight savings time. So the time should be UTC – 6 hours. So, 11:05 pm on Saturday would be 7 Sep 2014 05:05 UTC.
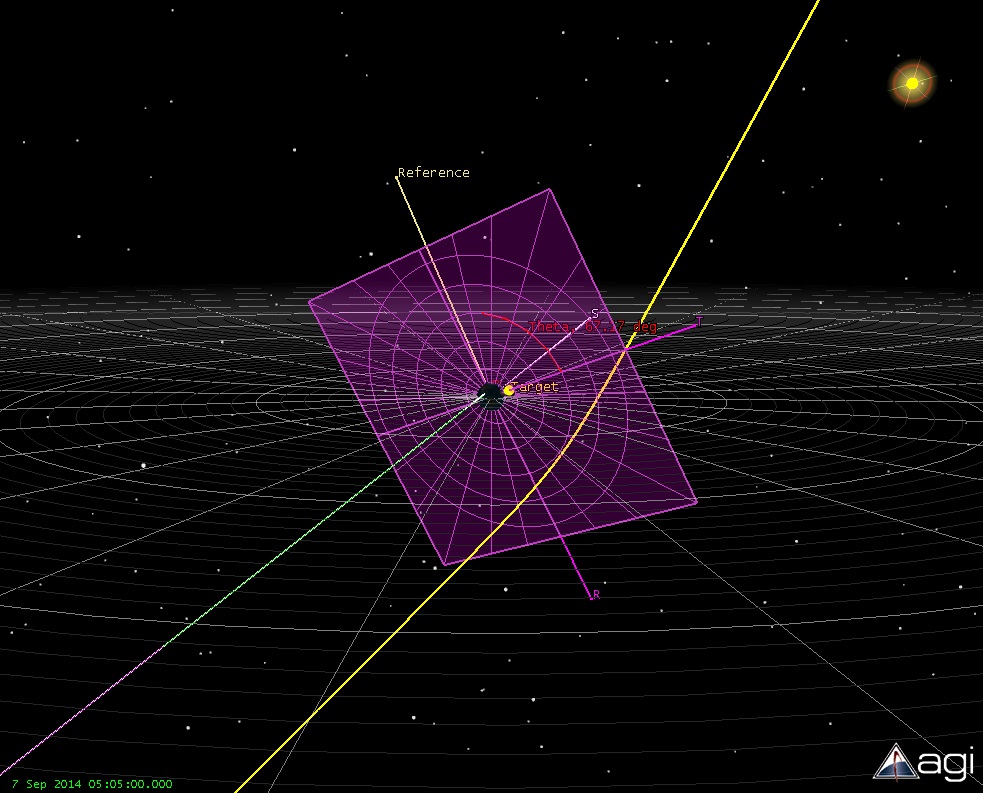
So, with the location and the time, we can see if the Hotel was on the side of the Earth from which the asteroid was coming from:
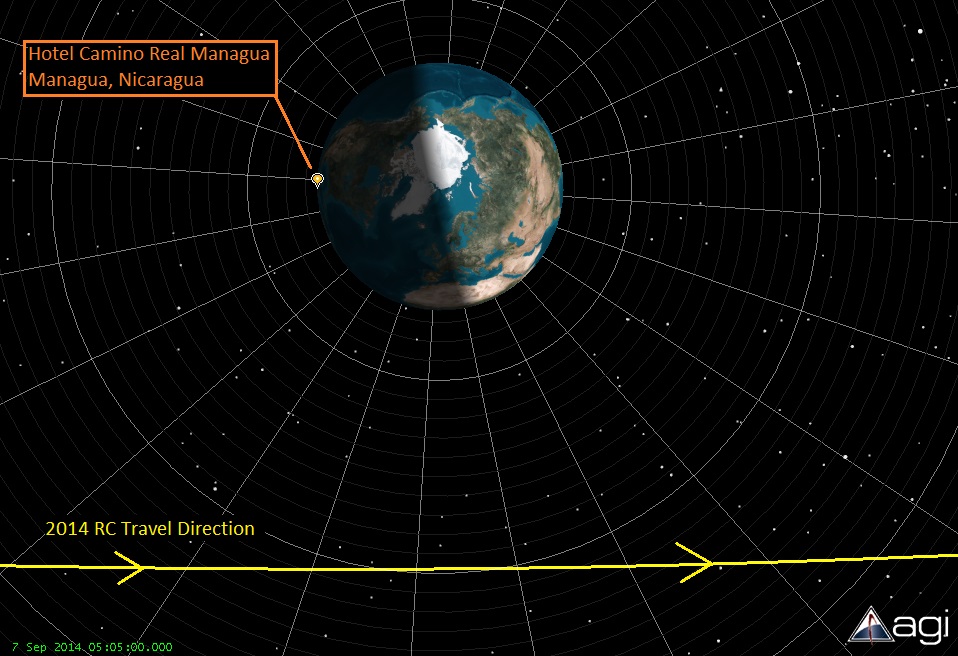
So, that seems pretty obvious. (Even if the time is off by an hour or so, it’s still on the correct side of Earth.) In this STK view, asteroid 2014 RC is traveling from left-to-right, and the hotel near which the crater was found is on the same side of the Earth. So far this myth is NOT busted; it’s plausible.
So the direction seems reasonable, but we want to see if it’s reasonable that this meteorite could have come off of asteroid 2014 RC. We can use a similar approach that several us did a few years ago investigating a potential space debris collision, as written in the paper “INVESTIGATING ORBITAL DEBRIS EVENTS USING NUMERICAL METHODS WITH FULL FORCE MODEL ORBIT PROPAGATION.” (by Timothy Carrico, John Carrico, Lisa Policastri, Mike Loucks, AAS 08-126.) We can see if a reasonable force applied in the past could have knocked a rock off of 2014 RC, or perhaps another impact caused a chunk to be thrown off.
We can model this in STK/Astrogator by getting an initial state for 2014 RC in the past, and calculate what delta-V (change in velocity) would be needed to divert from 2014 RC’s trajectory to hit near the hotel at the observed time. Not knowing when the meteorite could have left its host, I chose to investigate the case if the rock left the asteroid 10 years ago. So, using our favorite “Follow Segment” in Astrogator, I propagated the initial state of the Asteroid that Adam had found backwards in time for ten years. Then I modeled a small impulsive delta-V, and set up the Astrogator targeter to calculate the delta-V needed to hit the hotel at the specific time. I set up the targeter to hit Earth B-Plane values of B dot T = 0.0, and B dot R = 0.0 (hitting the Earth right in the middle, as seen from the approaching asteroid). And when that profile converged, the next targeting profile targeted the exact latitude and longitude of the hotel.
The B-Plane at the Earth as defined by the incoming meteorite trajectory.
This converged pretty quickly, and gave a delta-V number of about 90 meters/second. Since an impact velocity of an asteroid could be 10 or more km/second, this low value seemed very reasonable. And, if the rock had come off a hundred, or several thousand years ago, it would take even less delta-V to hit near the hotel. So, once again, the myth is NOT busted, and it’s very plausible that this meteorite came off of asteroid 2014 RC as some point in the past.
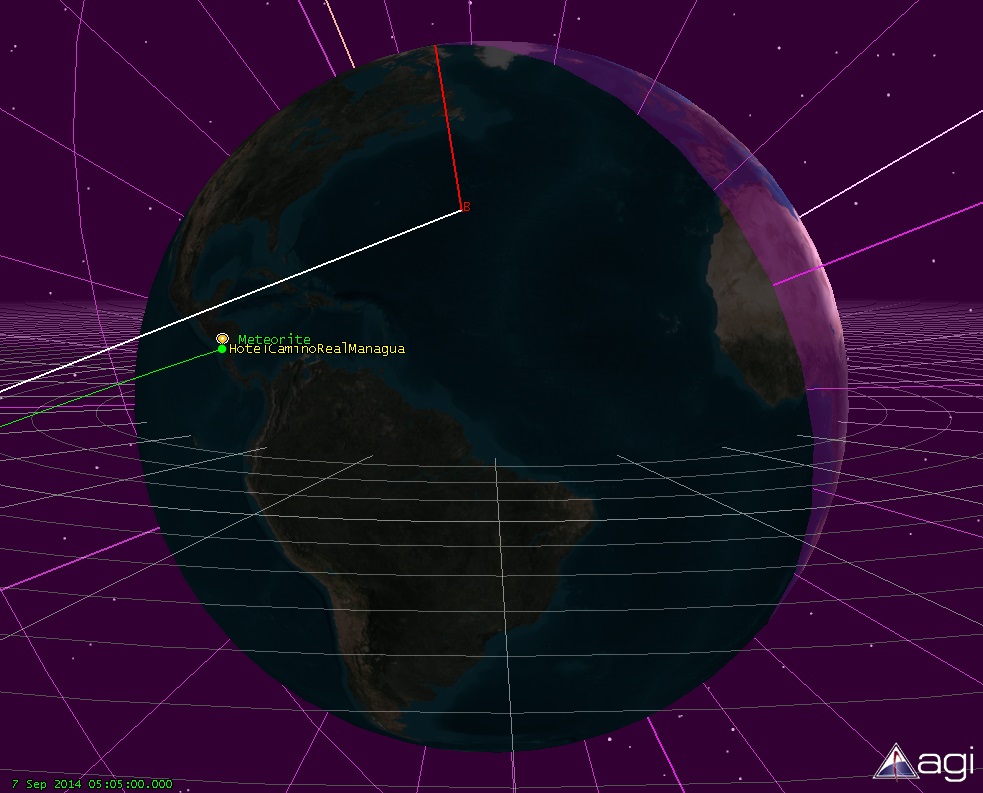
Close up view of the meteorite trajector impacting near the hotel
-Astrogator John
Post Landing Look at the Chang’e 3 Trajectory
The Chang’e 3 Lander is on the surface! What an amazing accomplishment for our Chinese friends. Now that it’s down, let’s take a look back at our guesses of the trajectory and see what we got wrong, and what we know about the real trajectory now that we know the landing site and the time of the landing.
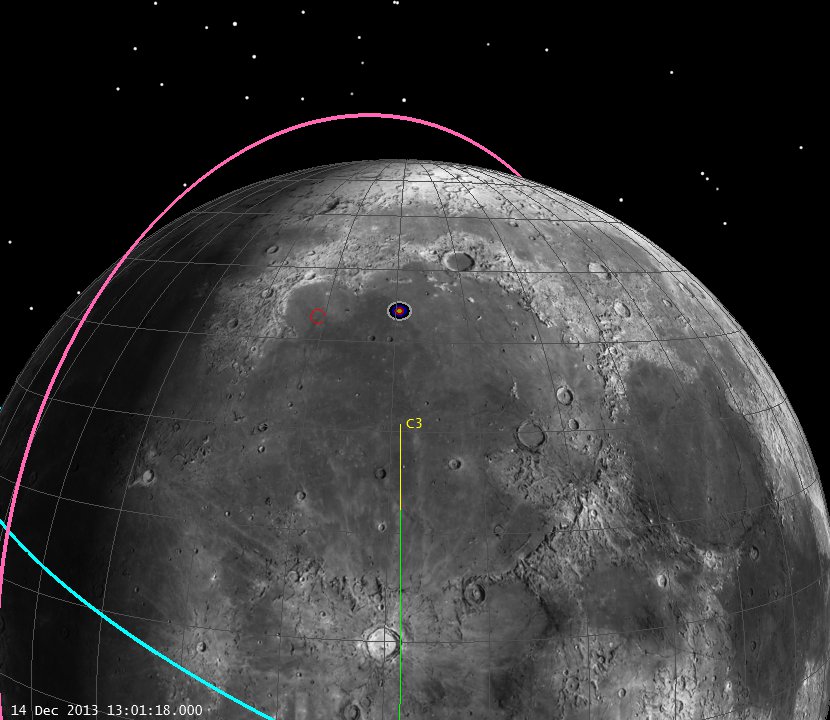
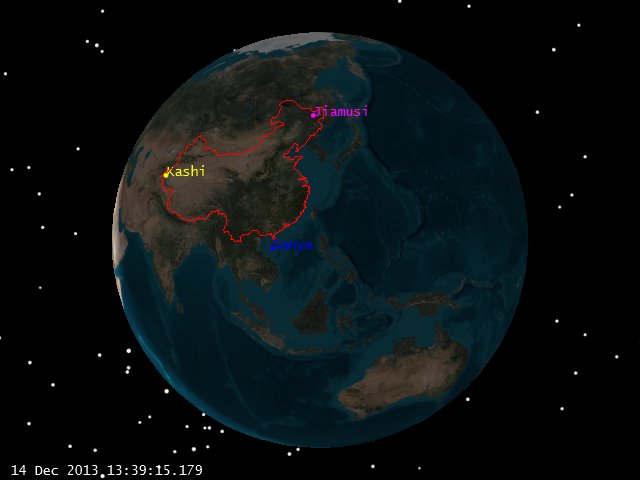
First off, note the real landing site, compared to the landing site that was identified pre-launch
Real landing site/time Lat = 44.12 deg N. Lon = -19.51 W @ 13:11:18 UTC.
Reported site/time Lat = 43.07 deg N. Lon = – 31.05W @ 13:40 UTC
Real landing site with the bullseye to the east, prelaunch reported site to the west.
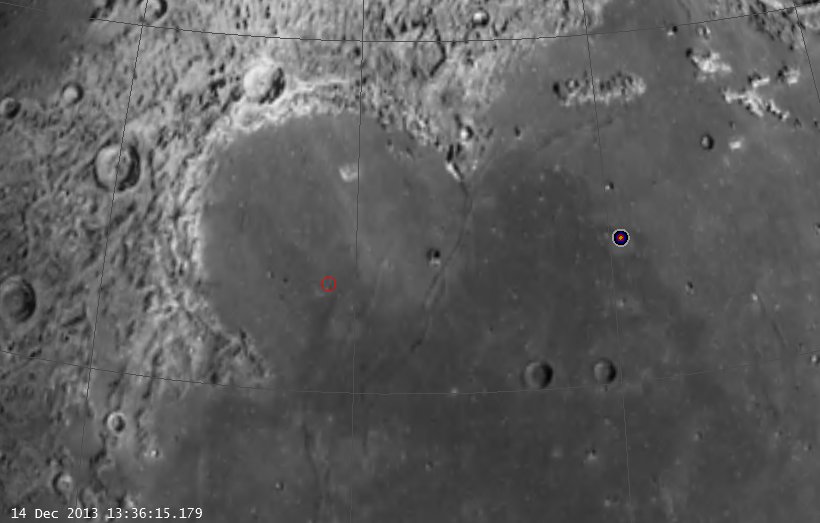
Real vs. Reported Landing Site (click to zoom)
So what does this tell us?
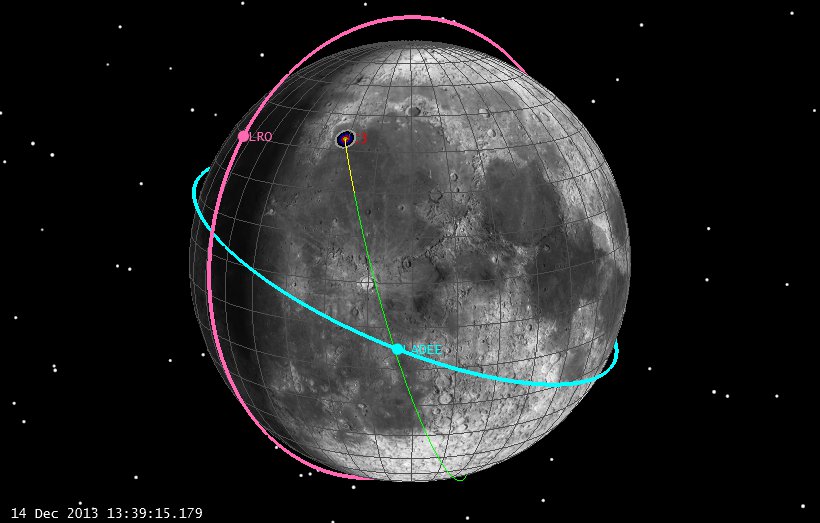
As we suggested in our earlier posts, the reported landing site could not be achieved at the landing time from a 90 deg inclination orbit. The actual landing site, however, could be (and was) achieved from 90 degrees. Let’s check out then, what it must have been (LRO orbit in magenta, LADEE orbit in Blue, neither on the same side during the landing):
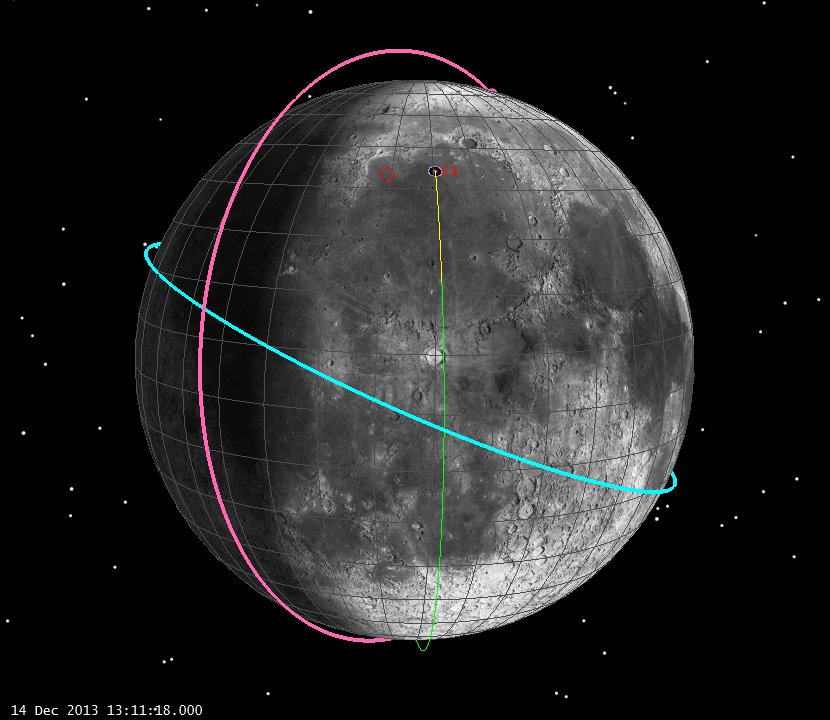
Real Landing Geometry of Chang’e 3 (click to zoom)
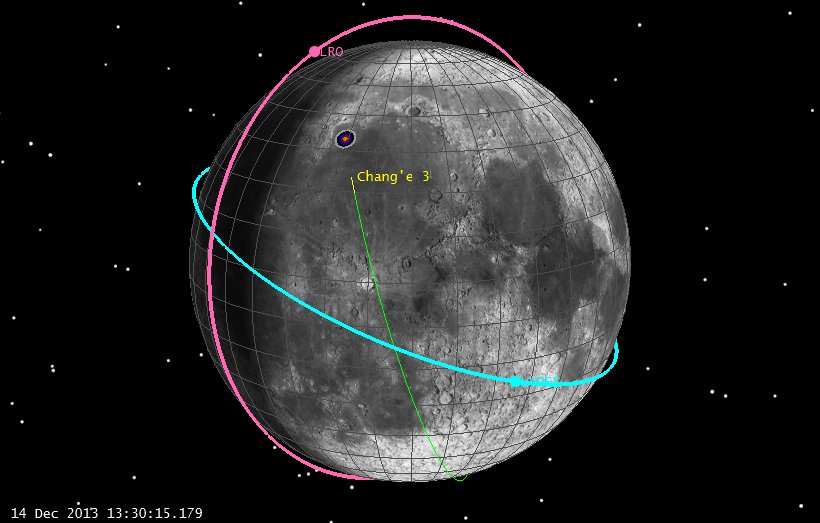
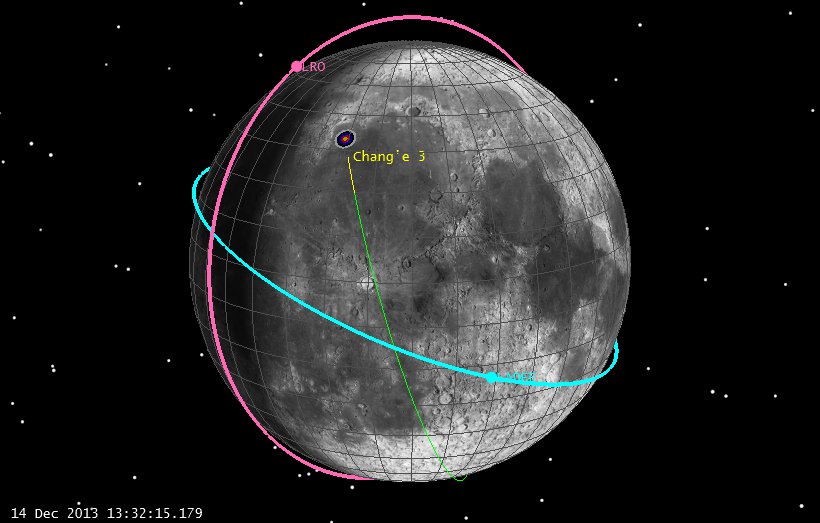
And ten minutes before:
Real Landing Geometry of Chang’e 3, L-10 min (click to zoom)
So we didn’t need a different inclination, 90 degrees was fine. With the proper landing time and site, we would have had a really good estimate of the trajectory. It’s all “basic geometry, and we know about that!”
Finally, here’s the local terrain looking from the southwest.
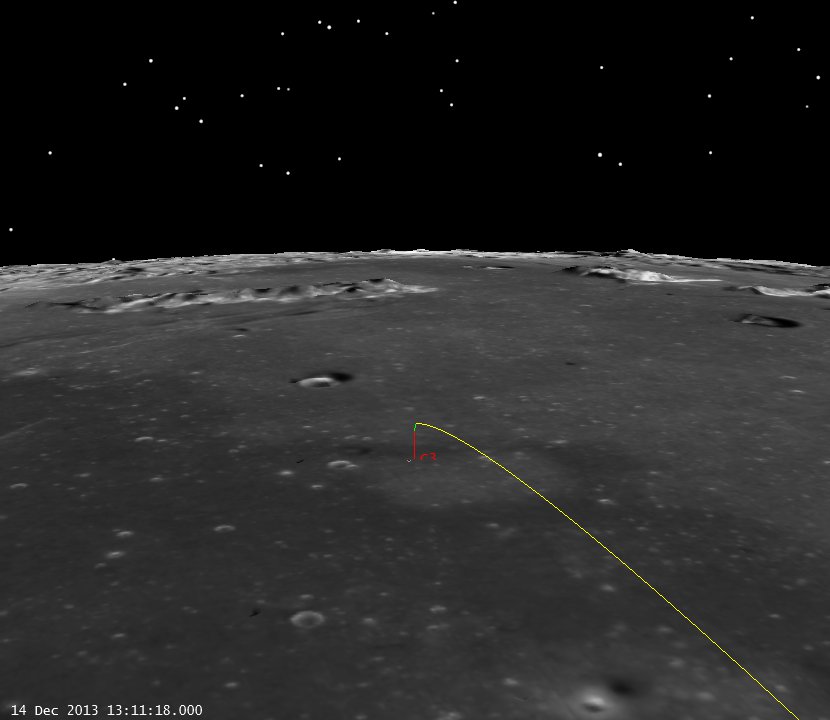
Chang’e 3 Landing Site, (click to zoom)
Again, really cool work by the Chinese Chang’e 3 Team!
-Astrogator_Mike
One last guess at the Chang’e 3 Landing
With our last post, we identified the overall nature of the Chang’e 3 trajectory, now let’s try to narrow it down a bit to see what the landing approach might look like.
Firstly, we should add to the previous post. You might have noticed in the last posting:
Chang’e 3 LOI Geometry (Click to zoom)
We show here a lunar arrival from the North. That’s not the only available approach. We could also approach from the south and get the same inclination:
Chang’e 3 North and South LOI approach (click to zoom)
Which gives us two possible approaches to the landing site. Our current information has the spacecraft approaching the site from the south, so we can switch things to accommodate that.
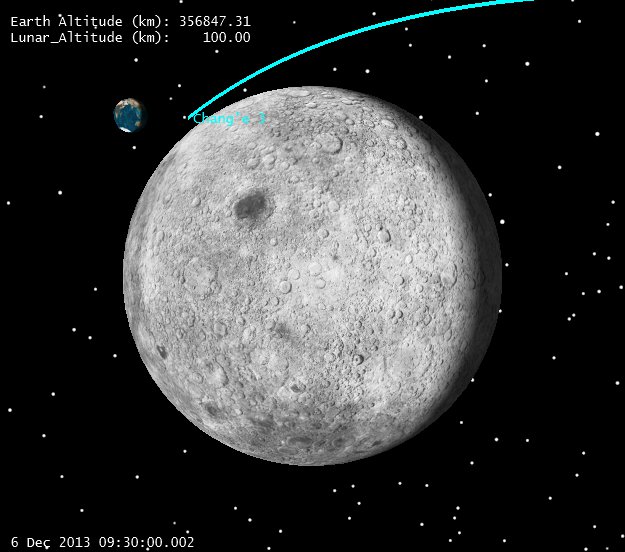
Our Chinese friends announced that they did achieve LOI at 6 Dec 2013 09:53. This time represents the conclusion of a 361 second burn, which places the center of the burn at 9:50. That’s where we can put our impulsive LOI maneuver.
Once there, we’ve been told C-3 circularized in a 100 x 100 km (altitude) orbit.
From there we are told (from Robert Christy @Zarya_info):
1. The periselene was dropped to 15 km on Dec 10 13:20 UTC
2. The periselene will be further dropped to 2 km on the orbit before landing.
3. Landing will take place in Sinus Iridum with coordinates 43.07 deg N Lunar Latitude, 31.05 deg W Lunar Longitude.
5. Landing will take place Dec 14 13:40 UTC with the landing start at 13:26 UTC from periselene
Can we deduce the landing profile, and thus the inclination from this? Perhaps.
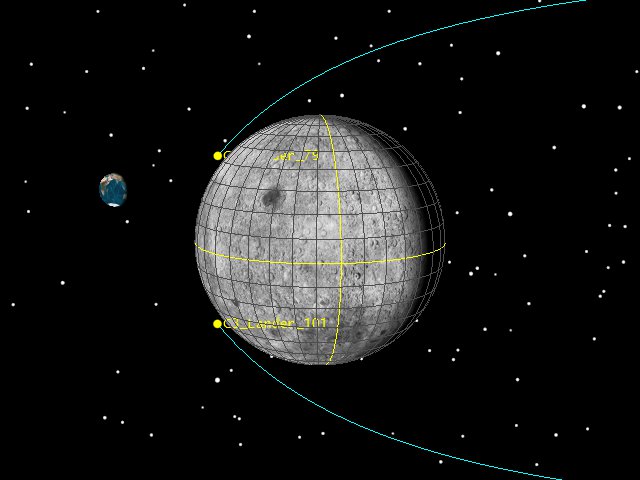
Note that all press so far has referred to this orbit as merely “polar”. While we might assume this means exactly 90 degrees, I don’t think it can be 90 if we stick with the landing site and landing times we list above. See below that if we assume a 90 degree inclination, we can’t get to the appointed landing site at the appointed time (bullseye represents identified landing zone):
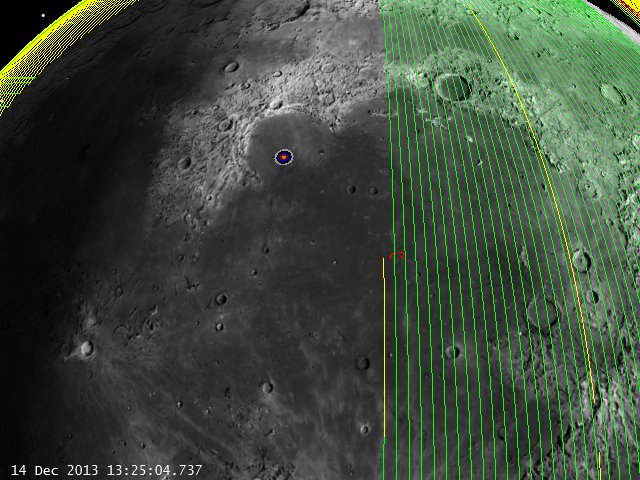
90 deg inclination Moon Fixed orbit track (click to zoom)
Note the time in the lower left. Lowering and raising the orbit won’t help, the Moon simply hasn’t rotated under our orbit plane at the landing time. How confident are we of the orbit plane? Pretty confident. The cislunar transfer is relatively fixed. We know the launch time, launch site, perigee location and the transfer time to LOI. We know (roughly) the capture aposelene altitude, so we’re only left with inclination to play with. Could there be a plane change somewhere after LOI? Sure, but this seems like a pretty unlikely fuel cost, especially when we can just get what we want by changing our inclination. Another way of looking at this is to check it out in inertial space:
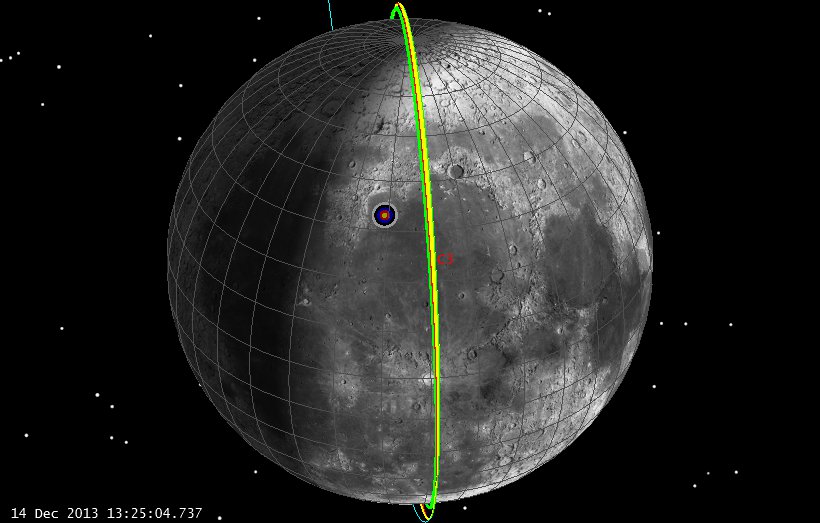
90 deg inclination Moon Inertial orbit track (click to zoom)
This makes things a bit more clear. Our orbit plane is pretty inertial (note the orbit plane is pretty fixed over a week of time in orbit since LOI). We just have to wait for the Moon to rotate underneath. If we land on the 14th at 13:40, our site just isn’t there yet. However, if we change our inclination to about 105 degrees:
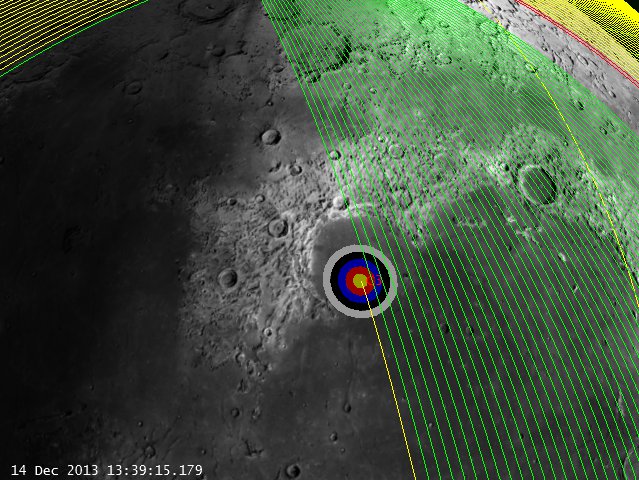
104.7 deg inclination Moon Fixed orbit track (click to zoom)
Again with the inertial view:
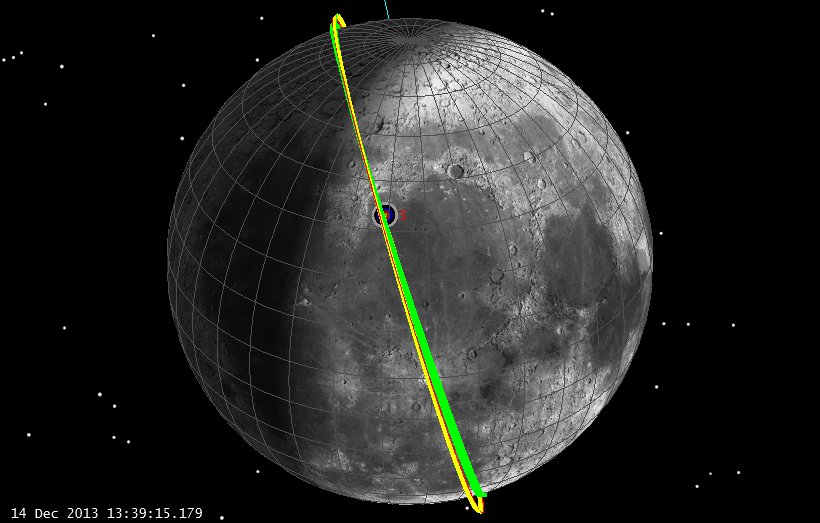
104.7 deg inclination Moon Inertial orbit track (click to zoom)
We can see that a bit of inclination gives us just what we need, a relatively “polar” orbit, a ground track over the site, and a landing time that’s about right.
Let’s look again at what’s the view of Earth during landing:
Moon view of Earth at Landing (click to zoom)
Pretty good geometry, all 3 major Chinese ground stations well above the horizon for many hours.
So what are the sources of errors here? Many. We certainly don’t match the AOS and LOS times published. Those can easily be explained by the fact that we don’t know the actual parking orbit dimensions. We’ve been assuming 100 x 100 km circular (and we’ve played with that a bit to make things be timed right) but we’ve got 50+ revs in orbit for errors to build up, and we this assumes a perfect insertion at 100 km periselene, and a perfect insertion. We also don’t know precisely what altitudes were reached with our periselene lowering maneuvers, nor where the first periselene lowering maneuver was targeted (15 km at first periselene after the burn, or 15 km 20 revs later?) So we’ve got a lot of slop. Still, let’s assume that our landing time and landing site are right, and let’s see where a couple of our US satellites are that we know pretty well.
[Disclaimer: While I (Astrogator_Mike) was the trajectory lead during the cislunar phases of LADEE, I am currently only very very part time on the mission as off-site support during science ops, and right now -at this very minute- I am blogging on my spare time on SEE company computers. The trajectory information I am using for both LADEE and LRO is readily available on the JPL Horizons site and comes from there. Thus, no NASA funds, computers, data or assets of any kind were used in the making of this blog posting and I am doing this in my spare time.]
So, where are LRO and LADEE? Based on spice files from the wonderful aforementioned JPL Horizons site, here are where our US orbiting robots are during the Chang’e 3 landing:
LADEE and LRO geometry at landing (Click to Zoom)
So let’s step through this a bit close to landing and see what our geometry is.

L -10 (click to zoom)

L -8 (click to zoom)
L -6 (click to zoo)
L -4 (click to zoom)

L -2 (click to zoom)
Let’s get a bit closer to the landing site, and see if LRO or LADEE can see the site:
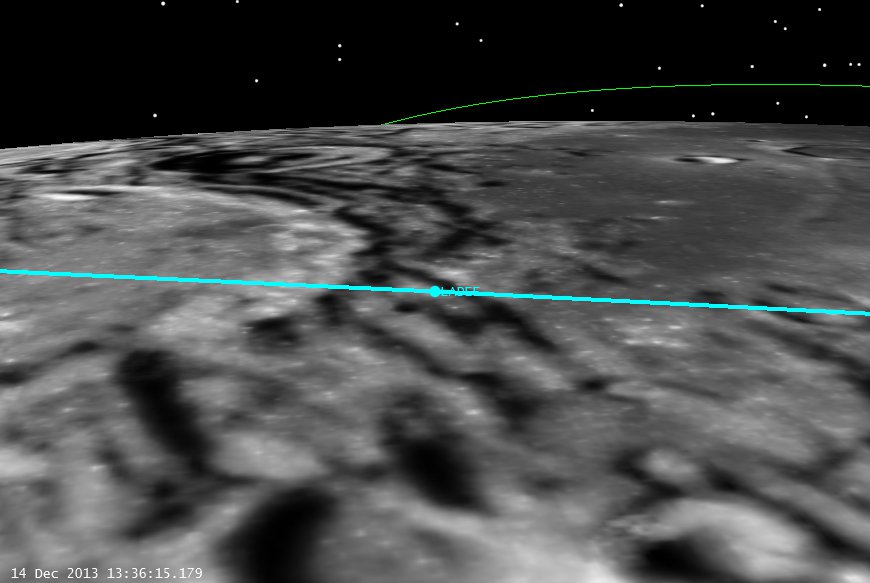
C-3 Landing from LADEE (click to zoom)
Of course LADEE has no camera on board (except the star trackers) but it won’t be able to see anything anyway. LRO, on the other hand, has a decent horizon view of the landing and might be able to see something against the star field. So from LRO we have:
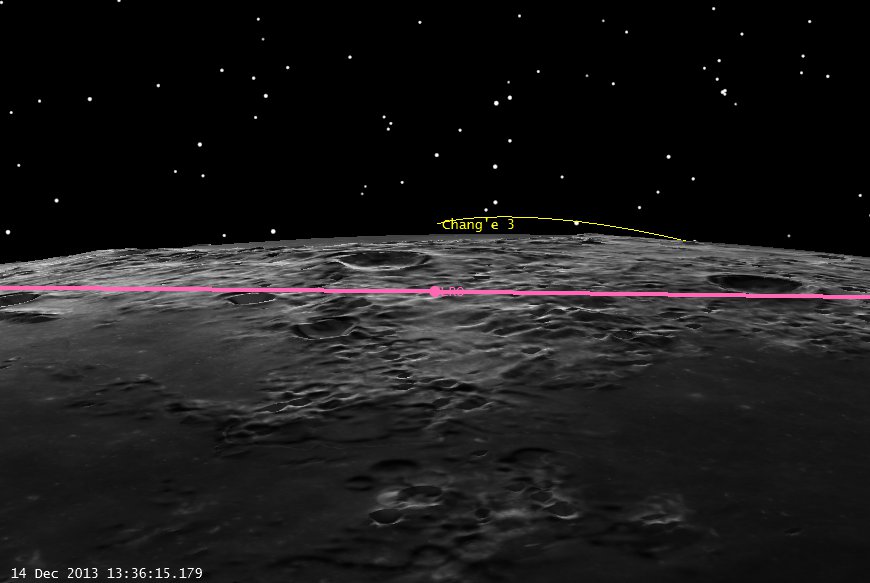
Landing from LRO (click to zoom)
Of course this all assumes that the times we have are right, but if LRO could somehow scan the area over the landing site during the right pass, they might be able to see something.
Regardless, good luck and godspeed to the Chang’e 3 controllers!
-Astrogator_Mike
